Metrics
The Metrics window allows you to monitor the health and performance of your integration flows to help you:
- Ensure the reliability and effectiveness of your automated flows and flow actions.
- Identify potential areas for improvement.
- Identify patterns in flow execution and peak usage to help optimise resources, for example, to smooth flow execution to avoid exceeding monthly usage quotas etc.
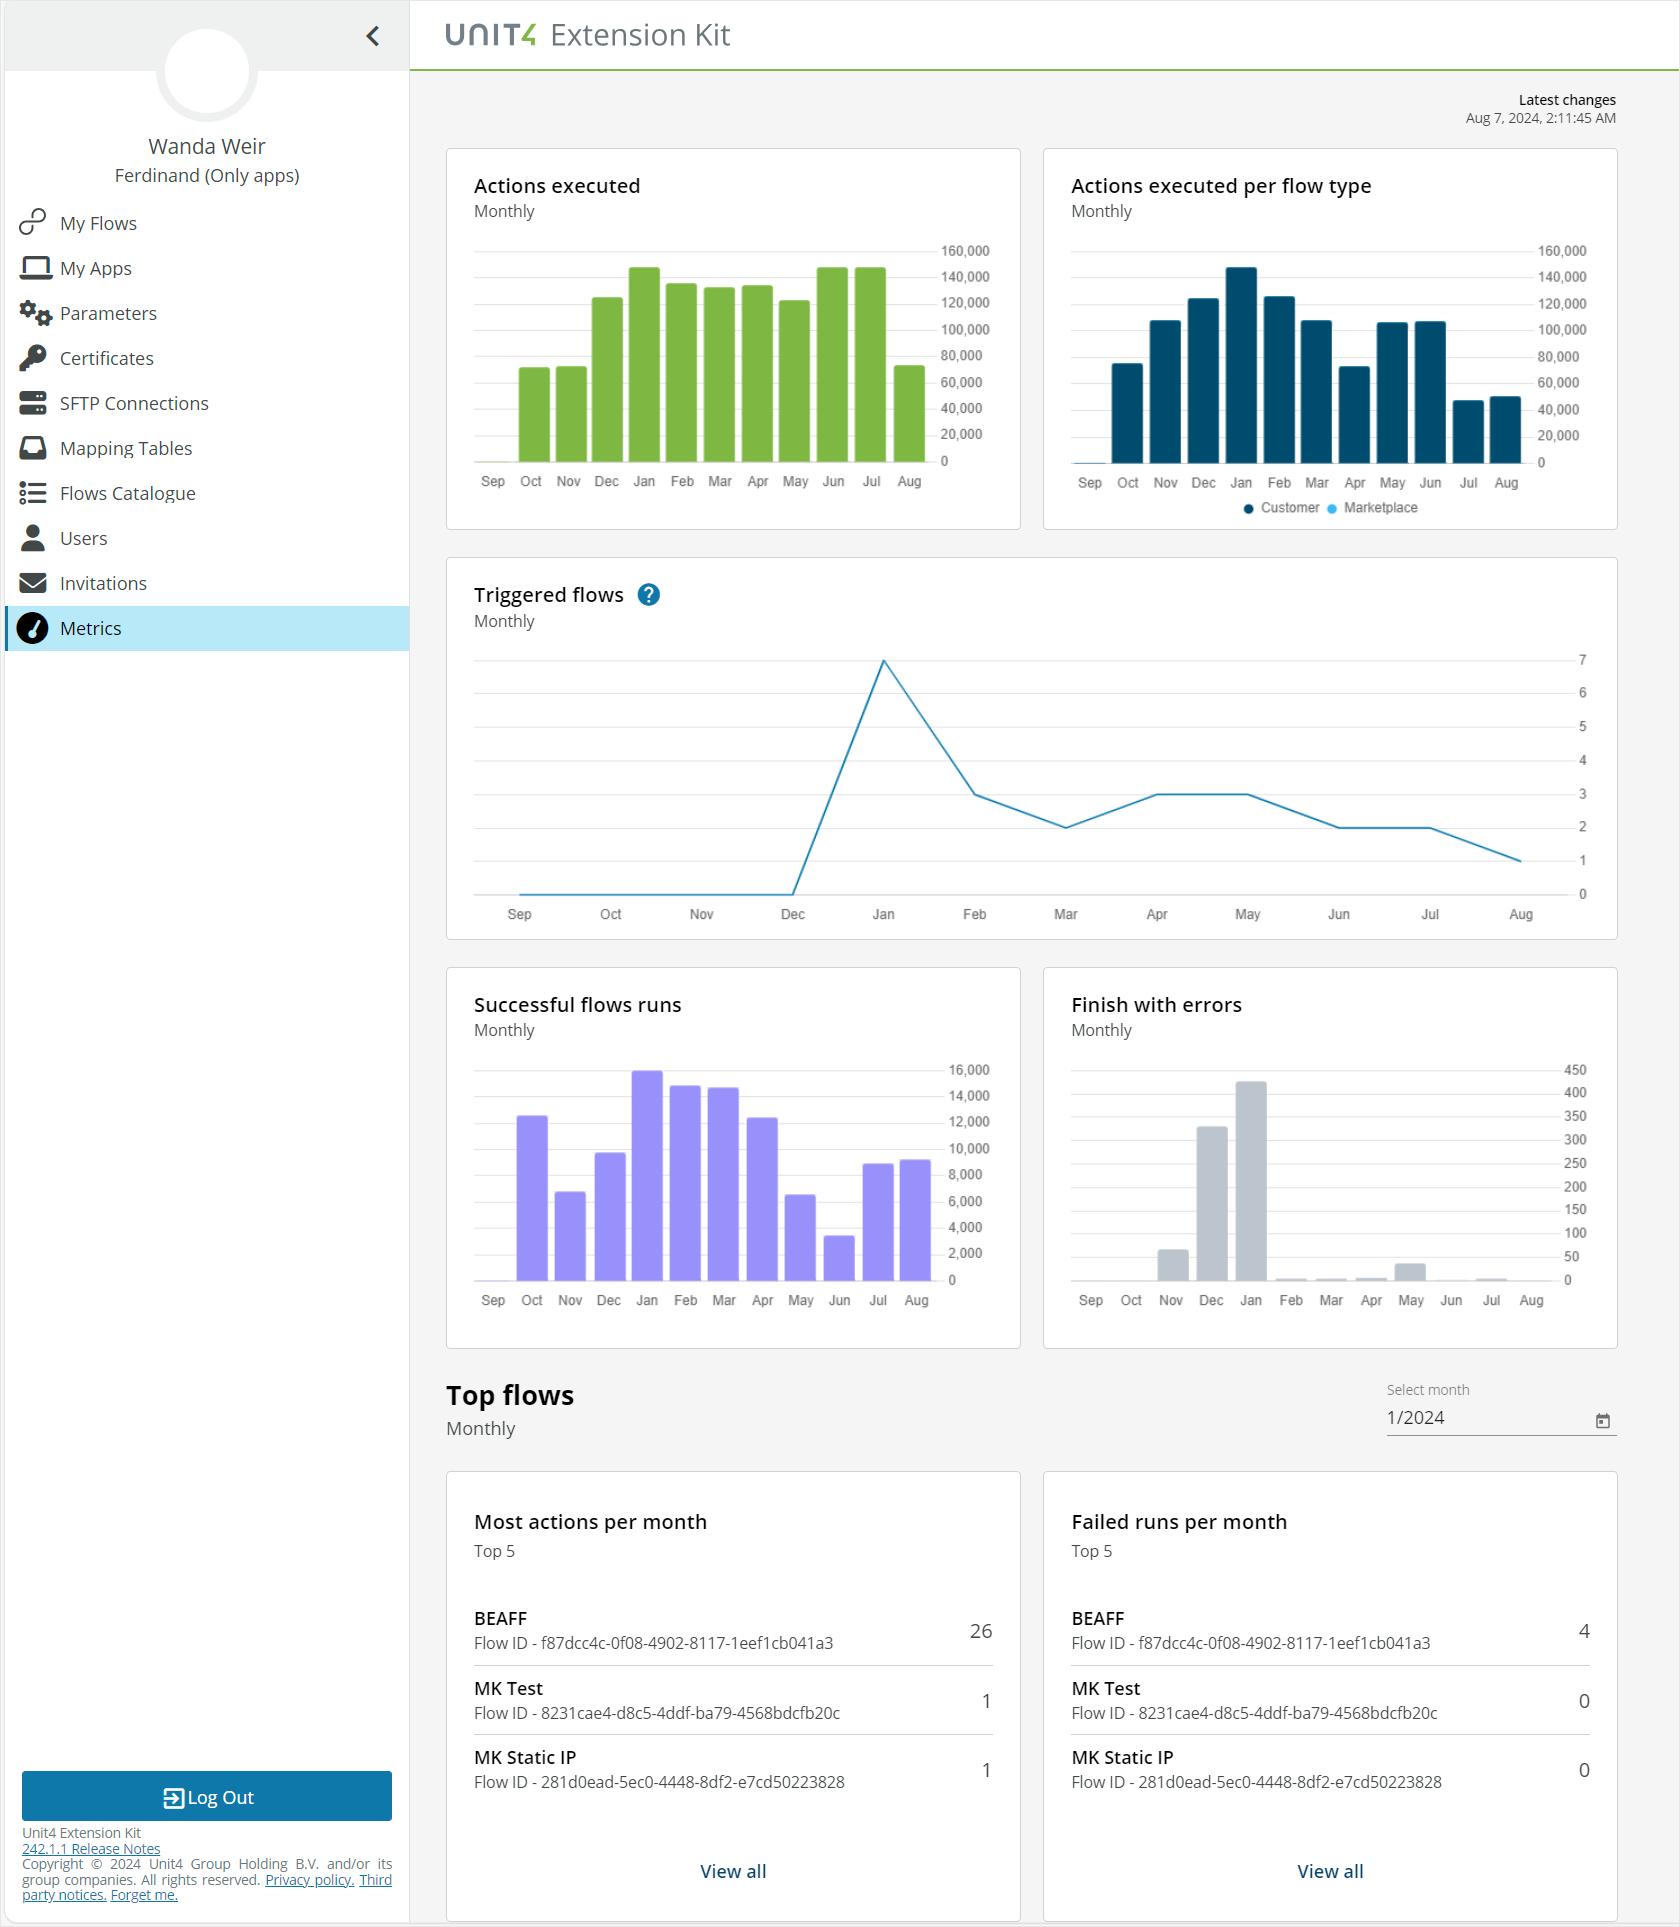
The Latest changes field shows when the metrics data was last updated.
The following metrics data is presented:
- Actions executed
- Actions executed per flow type
- Triggered flows
- Successful flow runs
- Finish with errors
- Most actions per month
- Failed runs per month
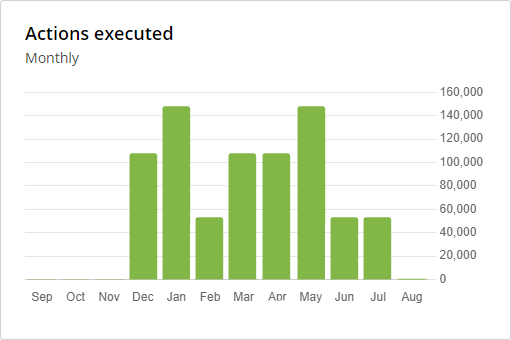
Actions executed
Actions executed shows the overall workload of the integration flows per month. A high number of executed actions indicates heavy usage, whereas a low number might indicate underuse or possible issues with the integration process.
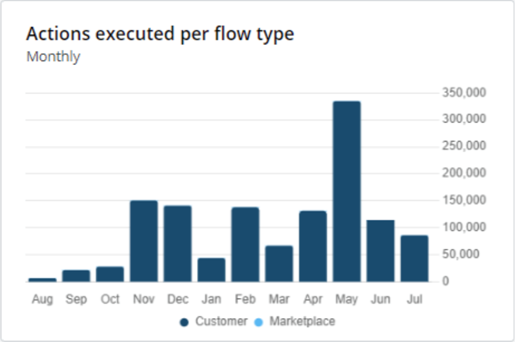
Actions executed per flow type
Actions executed per flow type shows which flow types are executing the most actions, and lets you compare which flow types are consuming the most resources for each month.
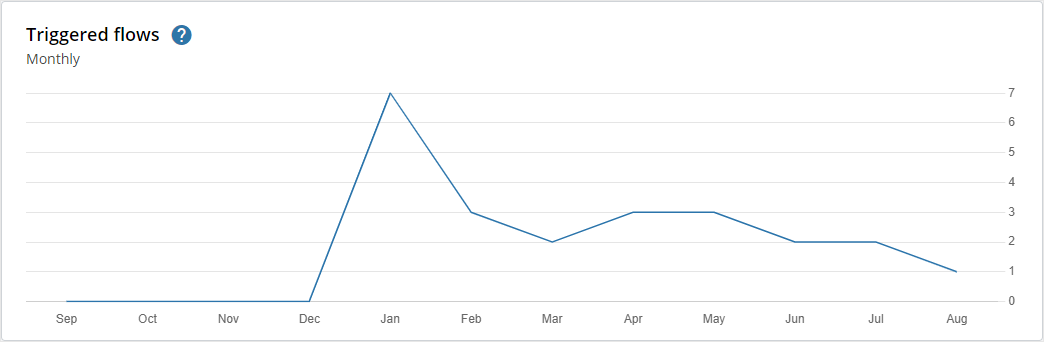
Triggered flows
Triggered flows shows the number of flows that have been triggered at least once within the month. These flows may or may not have run successfully.
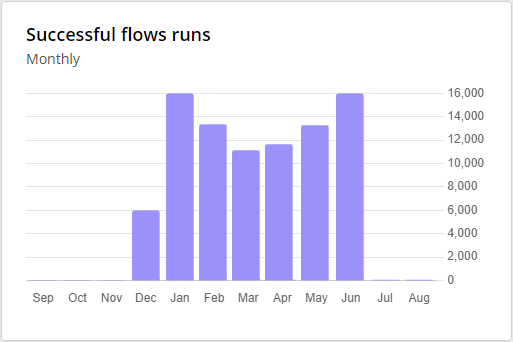
Successful flow runs
Successful flow runs shows the number of flows that have run successfully. These flows can contain errors that do not prevent them from running to completion.
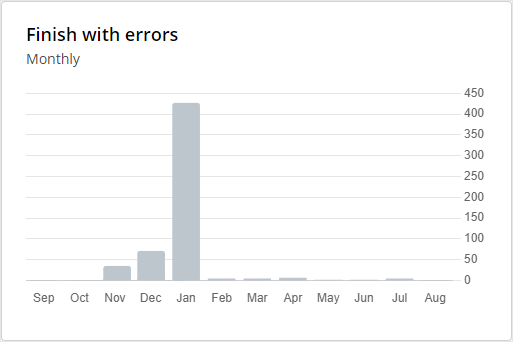
Finish with errors
Finish with errors shows the number of flows that have run to completion but contained errors. If flows are running with errors, this might indicate potential bottlenecks or failures in the flow or integration process.
Top flows
Top flows shows which flows ran the most actions, and which flows contained the most failed runs for the selected month. You can select the month and year in the Select month field. By default, the current month and year is selected.
Flows with the most actions shows flows with higher action counts which can suggest areas where flows or processes could possibly be optimized or streamlined to reduce complexity and improve performance.
Failed flows per month shows flows that have potential issues due to configuration errors or problems in the integration process.
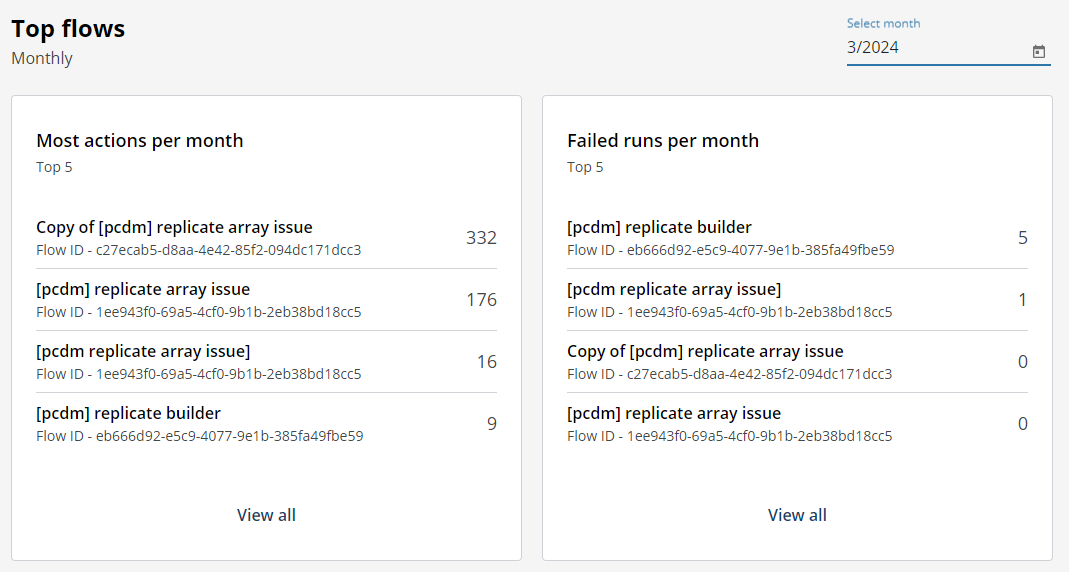
When you click on a flow, the flow designer opens for the selected flow.