Monitoring
The Monitoring tab is the landing page of the Extension Kit portal. It provides a centralised view of the Extension Kit and App Studio dashboards so you can monitor activity, KPI, and runtime health from one place.
Note: The Monitoring tab is designed for end users and individual customer tenants.
Extension Kit dashboard
The Extension Kit dashboard focuses on flow monitoring. It gives you a single place to track flow activity, review execution history, and monitor flow KPI.
It contains the following elements:
- KPI section: Displays the Email report, the KPI time range filter and the KPI cards.
- Run history section: Shows the Search bar, the Filters button, the Reset button, and the Flows executions table.
- Tops section: Displays cards with rankings of flows based on specific criteria.
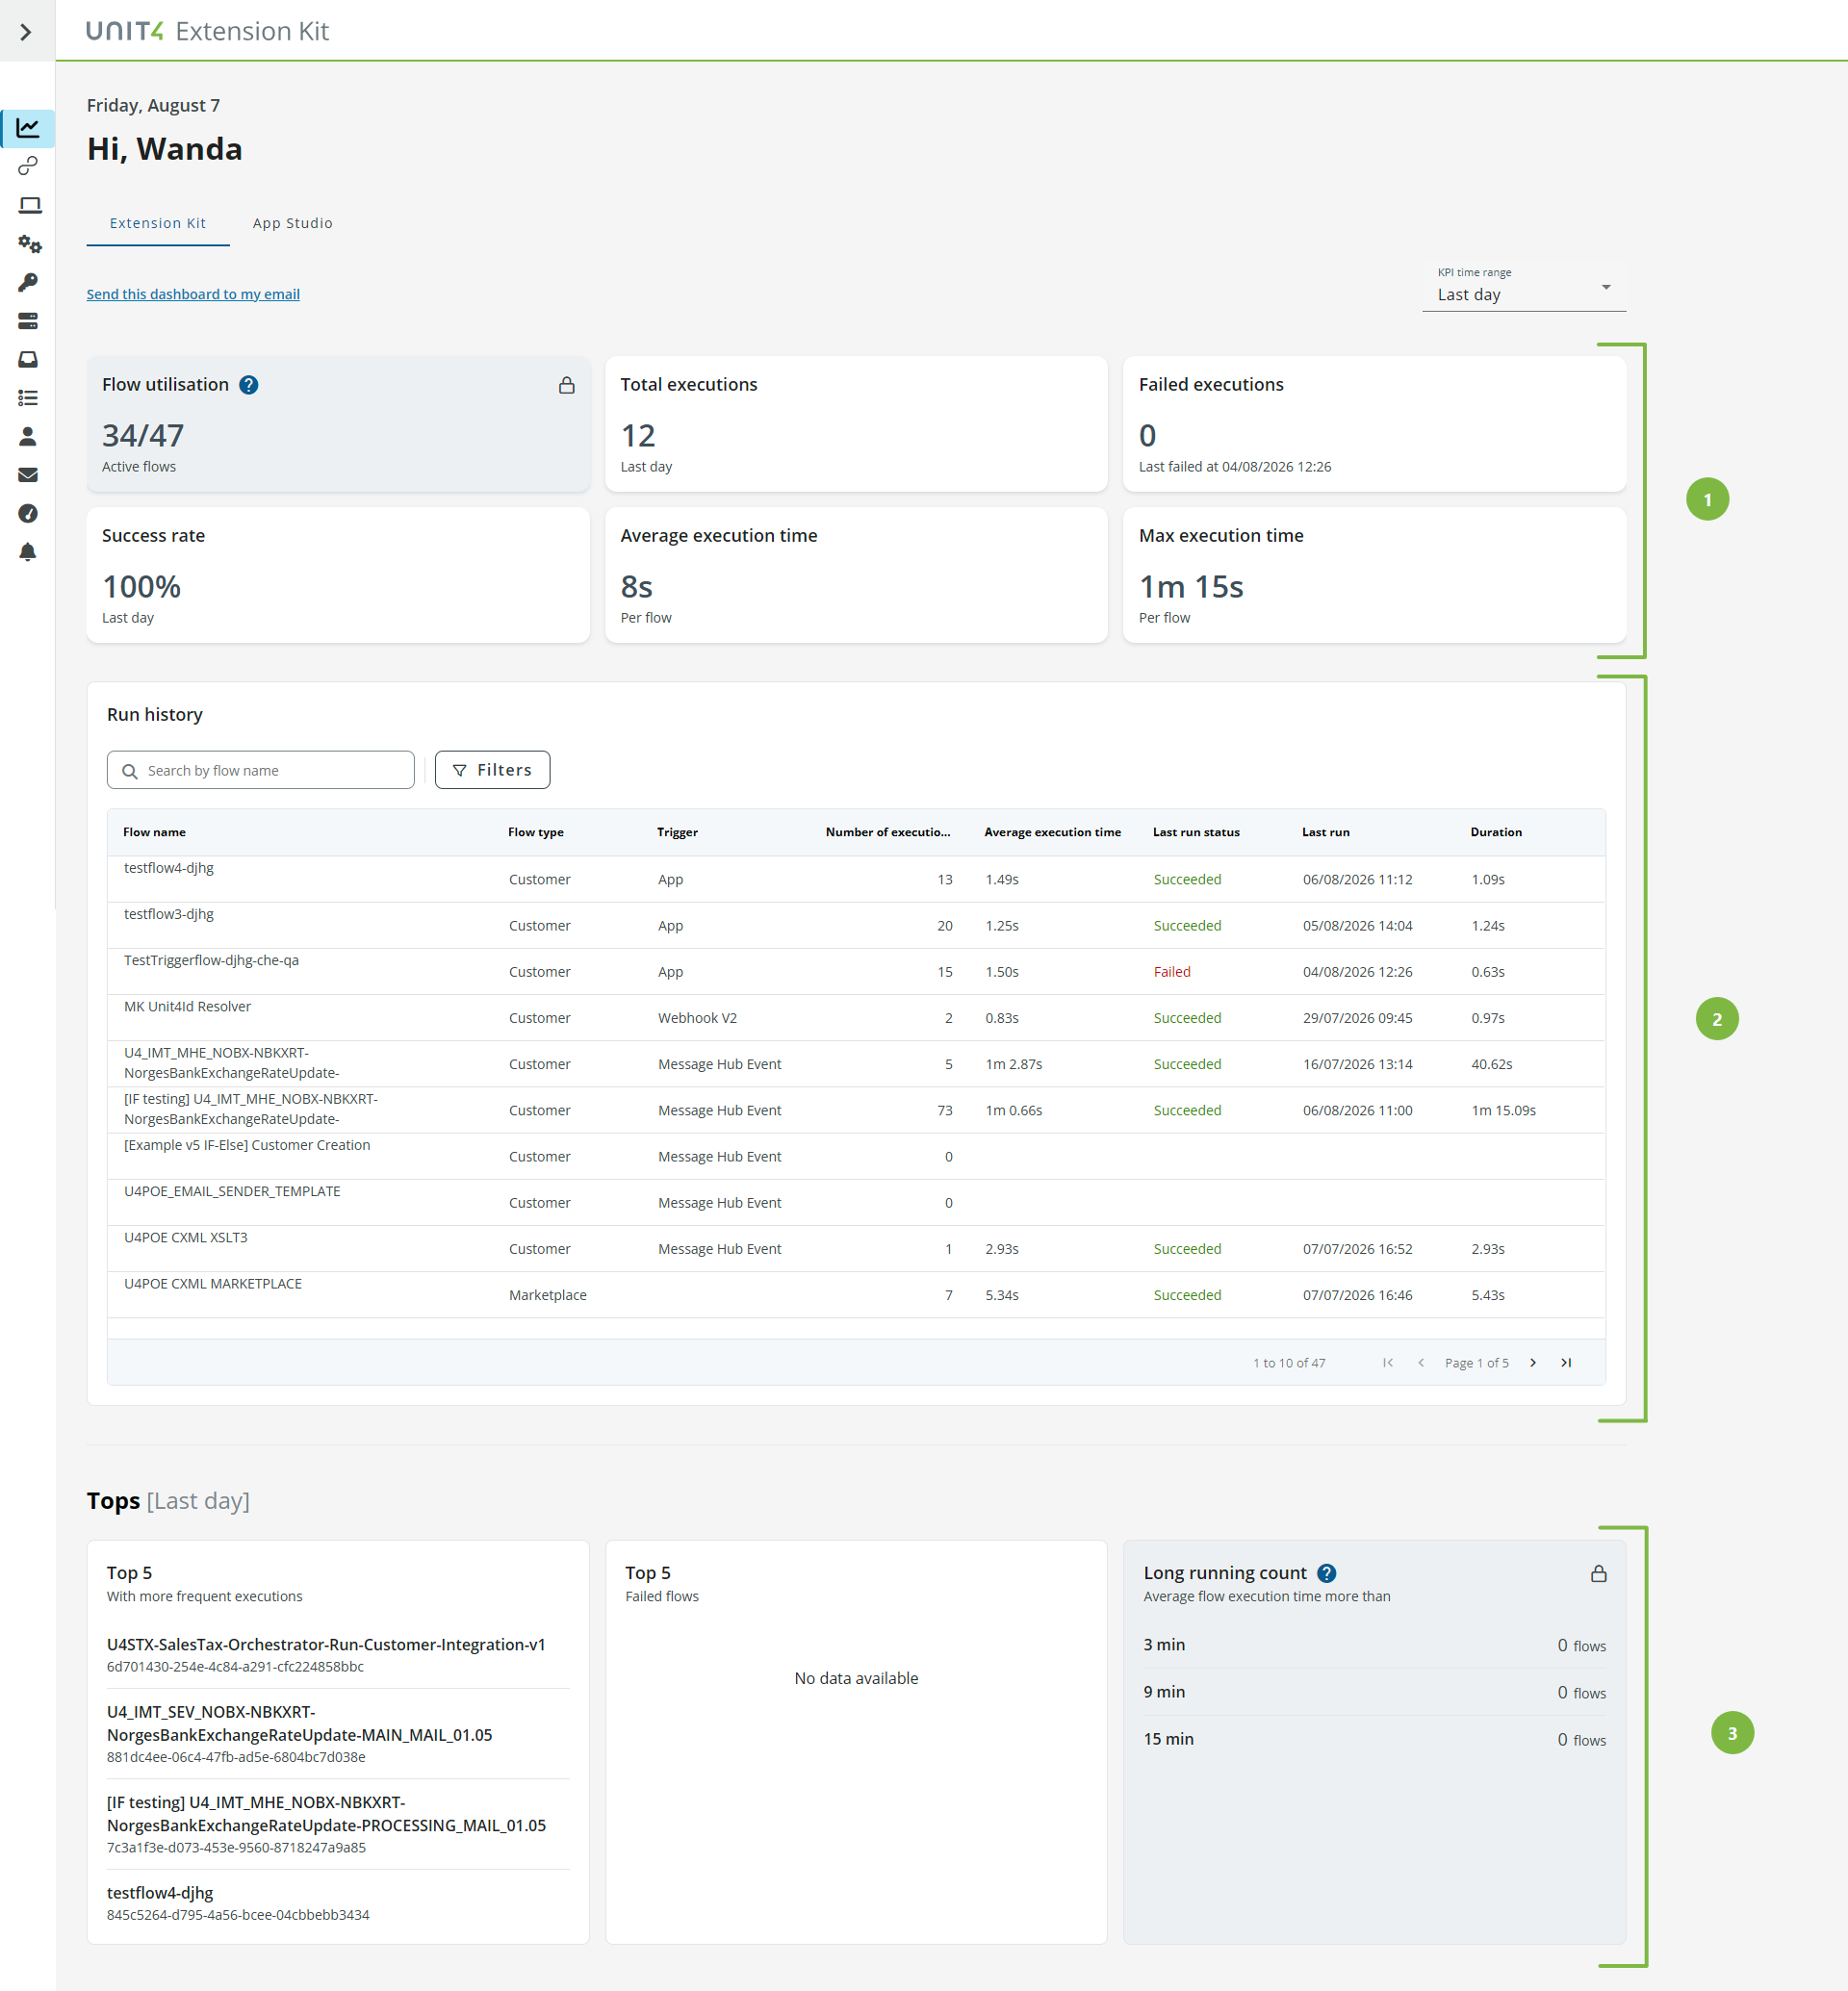
1. KPI section
The KPI section provides an overview of Key Performance Indicators for your flows.
Email report
The Email report link allows you to send the dashboard as an email to the currently logged-in user.
KPI time range filter
Select a predefined range from the KPI time range filter drop-down to see the KPI data.
KPI cards
The KPI cards provide a visual representation of Key Performance Indicators for your flows. Each card displays a specific metric:
| KPI card | Description |
|---|---|
| Flow utilisation | The total number of flows that are currently active against the total number of flows in the portal. This metric does not change with the KPI time range. |
| Total executions | The total number of flow runs within the selected time range. |
| Failed executions | The total number of flow runs that have failed within the selected time range. |
| Success rate | The percentage of successful flow executions within the selected time range. |
| Average execution time | The average execution time taken per flow. |
| Max execution time | The maximum time taken for a single flow execution. |
2. Run history section
The Run history section provides a comprehensive view of your flows executions, allowing you to search, filter and manage them effectively.
Use the Search bar to perform a basic search by flow name.
Filters button
Use the Filters button to apply multi-criteria filtering to the Flows execution table. You can filter by:
| Field | Description |
|---|---|
| Flow status | Select the flow status. |
| Execution status | Select the execution status. |
| Trigger type | Select the trigger type to filter the flows. |
| Tag | Enter a tag. |
Select Apply to apply the filters, or Clear to clear the filter fields. You can also select the Reset button to clear all applied filters.
Flows executions table
The Flows executions table shows details for the executions of each flow. Select a flow to open the flow in the Flow editor. You can sort the table by clicking column headers.
Note: Flows are displayed in pages of ten items each. Use the pagination controls at the bottom right of the table to navigate through the pages.
The Flows executions table shows:
| Field | Description |
|---|---|
| Flow name | The name of the flow. |
| Flow type | The type of flow: Marketplace or Customer. |
| Trigger | The flow trigger type. |
| Number of executions | The total number of executions in the last three months. |
| Average execution time | The average duration of flow executions. |
| Last run status | The status of the last flow execution. |
| Last run | The date and time of the last flow execution. |
| Duration | The total duration of the last flow execution. |
⚠ Warning: If you have too many flow executions, this table might appear empty.
3. Tops section
The Tops section of the Monitoring tab contains the following cards:
| Card | Description |
|---|---|
| Top 5 – With more frequent executions | Lists the five flows with the most frequent executions. |
| Top 5 – Failed flows | Lists the five flows with the most failed executions. |
| Long running count | Sorts flows into time buckets to track those that take longer than expected to complete. Helps identify performance issues before they cause failures. This metric does not change with the KPI time range. |
App Studio dashboard
The App Studio dashboard focuses on app monitoring. It gives you a single place to review app inventory and track usage.
It contains the following elements:
- KPI section: Displays the Email report, the KPI time range filter, and the KPI cards.
- Apps section: Shows the Apps table.
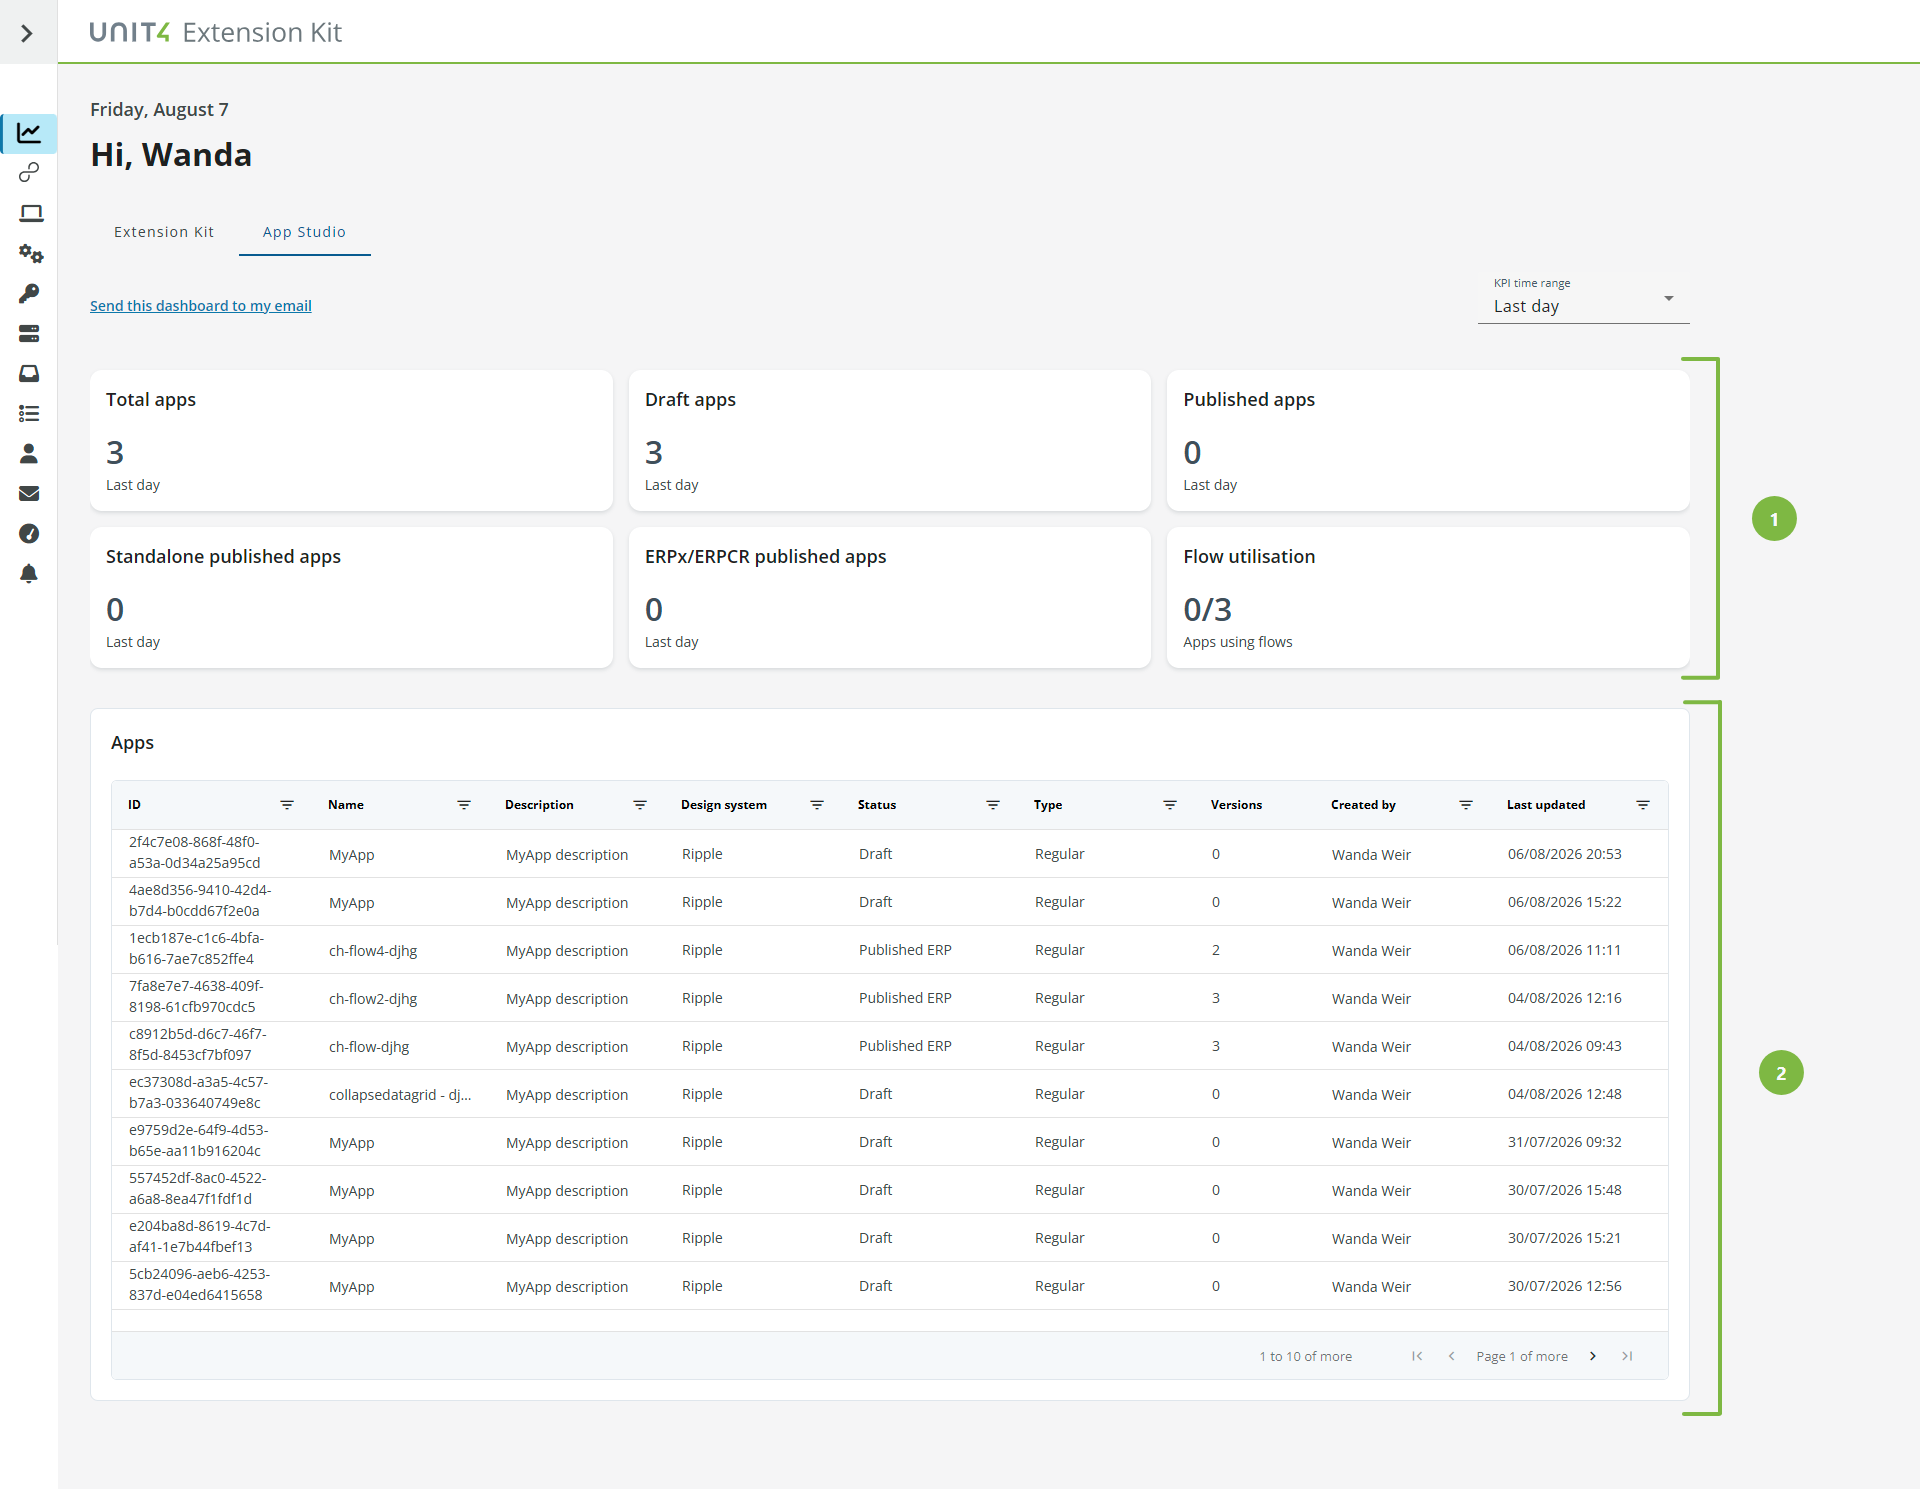
1. KPI section
The KPI section provides an overview of Key Performance Indicators for the apps in your tenant.
Email report
The Email report link allows you to send the dashboard as an email to the currently logged-in user.
KPI time range filter
Select a predefined range from the KPI time range filter drop-down to see the KPI data.
KPI cards
The KPI cards provide a visual representation of Key Performance Indicators for your apps. Each card displays a specific metric:
| KPI card | Description |
|---|---|
| Total apps | The number of all apps in the tenant, both draft and published. |
| Draft apps | The number of apps in draft state (not published). |
| Published apps | The total number of published apps (standalone and ERPx/ERPCR). |
| Standalone published apps | The number of published standalone apps. |
| ERPx/ERPCR published apps | The number of published apps that are ERPx/ERPCR menu entries. |
| Flow utilisation | The number of apps that use flows against the total number of apps. |
| Apps with errors | The number of apps that produced errors in the selected time range. |
2. Apps section
The Apps section provides a comprehensive view of the apps in your tenant.
Apps table
The Apps table shows details for every app in your tenant. Select a row to open the app in the Editor. You can sort by any column and filter by column.
| Column | Description |
|---|---|
| ID | The identifier of the app. |
| Name | The name of the app. |
| Description | The description of the app. |
| Design system | The design system used by the app: Ripple or U4Components. |
| Status | The status of the app, such as draft or published. |
| Type | Whether the app is a Regular or System app. |
| Versions | The number of versions of the app. |
| Created by | The user that created the app. |
| Last updated | The date and time when the app was last updated. |